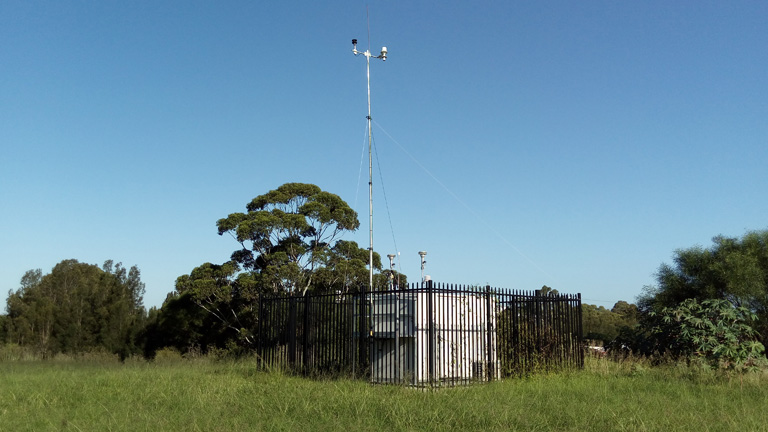
The Westconnex New M5 Instrument of Approval also requires a location in the general area of the New M5 but away from the smoke stacks to give data for comparison. The location is on Bestic Street, Rockdale, opposite Barton park.
| Month | PM2.5 monthly average, μg/m3 (yearly allowed average is 8) | PM2.5 highest 24 hours period, μg/m3 (allowed is 25) | PM2.5 annual average to here where reported, μg/m3 (allowed average is 8) | PM10 monthly average, μg/m3 (yearly allowed average is 25) | PM10 highest 24 hours period, μg/m3 (allowed is 50) | PM10 annual average to here where reported, μg/m3 (allowed average is 25) |
|---|---|---|---|---|---|---|
| January, 2019 | 11 | 20.3 | ||||
| February, 2019 | 7 | 15.7 | ||||
| March, 2019 | 8 | 15.8 | ||||
| April, 2019 | 10 | 26 | 14.1 | |||
| May, 2019 | 11 | 14.8 | ||||
| June, 2019 | 8 | 9.2 | ||||
| July, 2019 | 7 | 10.0 | ||||
| August, 2019 | 7 | 11.5 | ||||
| September, 2019 | 7 | 12.3 | ||||
| October, 2019 | 12.5 | 62 | 18.2 | 69.9 | ||
| November, 2019 | 22.2 | 57.6 | 33.2 | 112.8 | ||
| December, 2019 | 27.0 | 79.5 | 35.7 | 125.6 | ||
| January, 2020 | 23.0 | 56.5 | 11.9 | 31.0 | 75.9 | |
| February, 2020 | 7.6 | 11.9 | 14.4 | |||
| March, 2020 | 6.2 | 11.8 | 17.4 | |||
| April, 2020 | 8.2 | 18.8 | ||||
| May, 2020 | 7.2 | 13.4 | ||||
| June 2020 | ||||||
| July, 2020 | 9.9 | 25.4 | 14.4 | |||
| August, 2020 | 8.8 | 14.9 | ||||
| September, 2020 | 7.5 | 17.2 | ||||
| October, 2020 | 7.7 | 33.7 | 17.7 | |||
| November, 2020 | 8.6 | 22.8 | ||||
| December, 2020 | 7.2 | 18.9 | ||||
| January, 2021 | 10.4 | 20.6 | ||||
| February, 2021 | 11.8 | 17.8 | ||||
| March, 2021 | 6.1 | 18.3 | ||||
| April, 2021 | 8.0 | 27.6 | 20.1 | |||
| May, 2021 | 7.2 | 42.7 | 15.0 | |||
| June, 2021 | 6.8 | 13.7 | ||||
| July, 2021 | 5.9 | 13.5 | ||||
| August, 2021 | 6.5 | 25.1 | 15.2 | |||
| September, 2021 | 4.9 | 16.2 | ||||
| October, 2021 | 4.9 | 18.1 |
| Daily Target Exceedances | ||
|---|---|---|
| Reason in reports | Pollutant | Days |
| Unidentified regional event | PM2.5 | |
| Hazard reduction burning | PM2.5 | 27/4/2021, 3/5/2021, 21/8/2021 |
| Reason not given nor required to be given | PM2.5 | 29/4/2019, 30/10/2019, 31/10/2019, 1/11/2019, 2/11/2019, 11/11/2019, 12/11/2019, 19/11/2019, 21/11/2019, 25/11/2019, 26/11/2019, 29/11/2019, 2/12/2019, 3/12/2019, 4/12/2019, 5/12/2019, 6/12/2019, 7/12/2019, 10/12/2019, 19/12/2019, 21/12/2019, 26/12/2019, 31/12/2019, 1/1/2020, 2/1/2020, 4/1/2020, 5/1/2020, 11/1/2020, 12/1/2020, 17/1/2020, 24/1/2020 |
| Reason not given nor required to be given | PM10 | 30/10/2019, 31/10/2019, 12/11/2019, 19/11/2019, 21/11/2019, 26/11/2019, 29/11/2019, 2/12/2019, 3/12/2019, 4/12/2019, 5/12/2019, 10/12/2019, 19/12/2019, 21/12/2019, 31/12/2019, 4/1/2020, 12/1/2020, 23/1/2020, 24/1/2020 |
| Month | PM2.5 monthly average, μg/m3 (yearly allowed average is 8) | PM2.5 highest 24 hours period, μg/m3 (allowed is 25) | PM10 monthly average, μg/m3 (yearly allowed average is 25) | PM10 highest 24 hours period, μg/m3 (allowed is 50) | Highest CO rolling 8 hour average, ppm (allowed is 9) | Highest NO2 hourly average, ppb (allowed is 120) |
|---|---|---|---|---|---|---|
| July, 2015 | 13.1 | 22.5 | 15.7 | 27.8 | 1.5 | 36.0 |
| August, 2015 | 10.3 | 14.5 | 15.6 | 22.7 | 1.1 | 25.0 |
| September, 2015 | 11.6 | 15.4 | 18.2 | 28.0 | 0.8 | 21.0 |
| October, 2015 | 14.3 | 21.2 | 26.0 | 39.5 | 0.9 | 29.0 |
| November, 2015 | 13.1 | 20.7 | 24.8 | 47.2 | 0.6 | 32.3 |
| December, 2015 | 12.4 | 20.2 | 23.7 | 38.2 | 0.5 | 50.8 |
| January, 2016 | 10.3 | 19.5 | 22.7 | 34.5 | 0.6 | 34.4 |
| February, 2016 | 7.3 | 13.1 | 21.1 | 31.5 | 0.5 | 28.6 |
| March, 2016 | 5.3 | 11.9 | 15.2 | 28.2 | 0.8 | 33.8 |
| April, 2016 | 6.6 | 15.4 | 19.7 | 33.9 | 0.8 | 85.1 |
| May, 2016 | 10.9 | 33.9 | 19.8 | 51.6 | 1.2 | 44.6 |
| June, 2016 | 6.4 | 12.8 | 11.8 | 22.1 | 1.6 | 37.5 |
| Daily Target Exceedances | ||
|---|---|---|
| Reason in reports | Pollutant | Days |
| Hazard reduction burning | PM2.5 | 23/5/2015 |
| PM10 | 23/5/2015 | |