The monitoring results and the colour coding of result are explained in the Air Quality Monitoring for the New M5 section.
I am one of the three community representatives for Arncliffe.
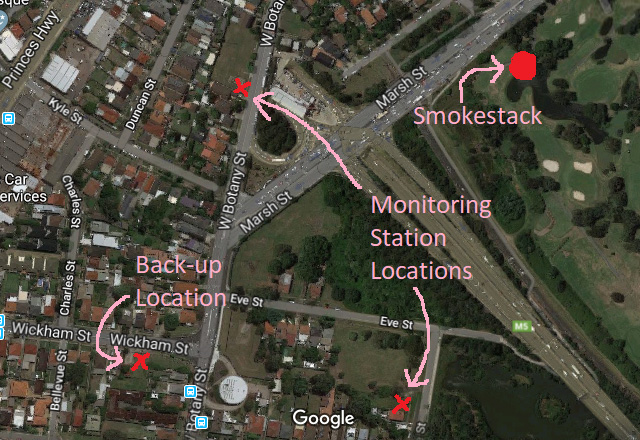
Below is a Google satellite shot on which I labelled the locations of the smokestack, of the monitoring station locations and of the monitoring station backup location.
In Arncliffe, the smokestack will be 35 meters high.
The project team has settled on one monitoring station on West Botany Street, between Marsh Street and the Princess Highway and on another one at 13 Eve Street.
My work on air quality in Arncliffe has led me to also study Sydney Airport International Terminal and how it contributes to the traffic problems in Arncliffe. I have created a separate site for that.
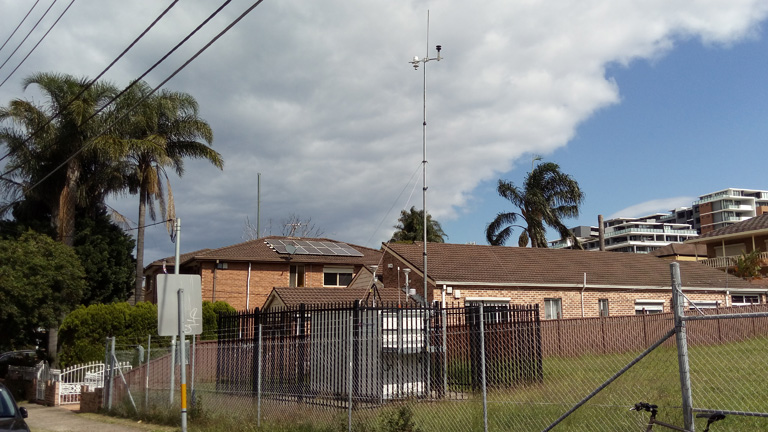
Of all the locations proposed for October 17, the one on West Botany Street is the best. It is not perfect but quite reasonable. It is pictured in the photo a bit further down. The site was previously used for air quality monitoring. A concrete slab and some fencing was already in place.
Below is a photo of West Botany Street air quality monitoring station.
| Month | PM2.5 monthly average, μg/m3 (yearly allowed average is 8) | PM2.5 highest 24 hours period, μg/m3 (allowed is 25) | PM2.5 annual average to here where reported, μg/m3 (allowed average is 8) | PM10 monthly average, μg/m3 (yearly allowed average is 25) | PM10 highest 24 hours period, μg/m3 (allowed is 50) | PM10 annual average to here where reported, μg/m3 (allowed average is 25) |
|---|---|---|---|---|---|---|
| January, 2019 | 10.3 | 29.1 | ||||
| February, 2019 | 8.7 | 20.5 | ||||
| March, 2019 | 7.3 | 21.7 | ||||
| April, 2019 | 8.7 | 27 | 18.8 | |||
| May, 2019 | 7.6 | 18.5 | ||||
| June, 2019 | 8.7 | 25 | 12.8 | |||
| July, 2019 | 8.0 | 13.7 | ||||
| August, 2019 | 7.6 | 16.1 | ||||
| September, 2019 | 6.9 | 73.7 | 18.5 | |||
| October, 2019 | 11.6 | 62 | 25.7 | 77.8 | ||
| November, 2019 | 19.6 | 57.0 | 39.1 | 117.2 | ||
| December, 2019 | 24.1 | 73.7 | 40.8 | 116.4 | ||
| January, 2020 | 25.7 | 53.5 | 12.1 | 39.3 | 90.3 | |
| February, 2020 | 14.4 | 26.6 | 12.6 | 18.7 | 26.6 | |
| March, 2020 | 8.9 | 12.7 | 15.1 | |||
| April, 2020 | 10.1 | 17.3 | ||||
| May, 2020 | 8.9 | 13.9 | ||||
| June, 2020 | 10.5 | 13.1 | ||||
| July, 2020 | 10.1 | 14.2 | ||||
| August, 2020 | 9.0 | 14.6 | ||||
| September, 2020 | 6.9 | 15.8 | ||||
| October, 2020 | 7.3 | 33.3 | 17.0 | |||
| November, 2020 | 6.1 | 20.2 | ||||
| December, 2020 | 3.7 | 15.2 | ||||
| January, 2021 | 6.3 | 16.5 | ||||
| February, 2021 | 7.3 | 16.8 | ||||
| March, 2021 | 7.1 | 15.3 | ||||
| April, 2021 | 9.2 | 29.9 | 17.4 | |||
| May, 2021 | 7.7 | 33.0 | 14.3 | |||
| June, 2021 | 7.5 | 12.8 | ||||
| July, 2021 | 6.8 | 11.8 | ||||
| August, 2021 | 7.9 | 26.8 | 13.4 | |||
| September, 2021 | 6.4 | 14.2 | ||||
| October, 2021 | 6.8 | 16.1 |
| Daily Target Exceedances | ||
|---|---|---|
| Reason in reports | Pollutant | Days |
| Hazard reduction burning | PM2.5 | 3/7/2020, 27/4/2021, 30/4/2021, 3/5/2021, 4/5/2021, 21/8/2021, 22/8/2021 |
| Reason not given nor required to be given | PM2.5 | 29/4/2019, 21/5/2019, 30/10/2019, 31/10/2019, 1/11/2019, 2/11/2019, 3/11/2019, 11/11/2019, 12/11/2019, 19/11/2019, 21/11/2019, 26/11/2019, 29/11/2019, 2/12/2019, 3/12/2019, 4/12/2019, 5/12/2109, 6/12/2019, 7/12/2019, 10/12/2019, 19/12/2019, 21/12/2019, 31/12/2019, 1/1/2020, 2/1/2020, 4/1/2020, 5/1/2020, 11/1/2020, 12/1/2020, 16/1/2020, 17/1/2020, 24/1/2020, 27/1/2020, 29/1/2020, 2/2/2020 |
| Reason not given nor required to be given | PM10 | 26/10/2019/30/10/2019, 31/10/2019, 1/11/2019, 12/11/2019, 19/11/2019, 21/11/2019, 26/11/2019, 28/11/2019, 29/11/2019, 2/12/2019, 3/12/2019, 4/12/2019, 5/12/2109, 10/12/2019, 19/12/2019, 21/12/2019, 31/12/2019, 4/1/2020, 12/1/2020, 23/1/2020, 24/1/2020 |
| Month | PM2.5 monthly average, μg/m3 (yearly allowed average is 8) | PM2.5 highest 24 hours period, μg/m3 (allowed is 25) | PM10 monthly average, μg/m3 (yearly allowed average is 25) | PM10 highest 24 hours period, μg/m3 (allowed is 50) | Highest CO rolling 8 hour average, ppm (allowed is 9) | Highest NO2 hourly average, ppb (allowed is 120) |
|---|---|---|---|---|---|---|
| July, 2015 | The report states: "There is no reporting data for West Botany Street for July 2015 due to access issues." | |||||
| August, 2015 | The PM10 and PM2.5 are missing. The report states: "Gaps in the PM10 and PM2.5 data collected were caused by technical issues with the PM units and/or delays in the availability of collection materials." | |||||
| September, 2015 | 10.8 | 14.7 | 20.2 | 34.4 | 0.6 | 57.0 |
| October, 2015 | 13.0 | 19.8 | 28.3 | 41.9 | 1.1 | 54.3 |
| November, 2015 | 10.2 | 19.0 | 22.4 | 46.0 | 0.5 | 59.4 |
| December, 2015 | 13.6 | 23.1 | 25.4 | 43.9 | 0.5 | 51.3 |
| January, 2016 | 7.9 | 26.3 | 20.7 | 32.5 | 0.5 | 59.3 |
| February, 2016 | 7.5 | 18.5 | 20.5 | 32.9 | 0.5 | 44.7 |
| March, 2016 | 8.6 | 15.7 | 15.9 | 27.5 | 0.7 | 41.8 |
| April, 2016 | 13.5 | 24.1 | 21.2 | 32.4 | 0.8 | 62.4 |
| May, 2016 | 16.1 | 39.3 | 25.8 | 54.1 | 1.4 | 48.4 |
| June, 2016 | 9.9 | 17.9 | 15.6 | 26.0 | 1.7 | 46.4 |
| Daily Target Exceedances | ||
|---|---|---|
| Reason in reports | Pollutant | Days |
| No reason given | PM2.5 | 2/1/2016 |
| Hazard reduction burning | PM2.5 | 8/5/2016, 9/5/2016, 10/5/2016, 20/5/2016, 23/5/2016, 24/5/2015 |
| PM10 | 23/5/2016, 24/5/2015 | |
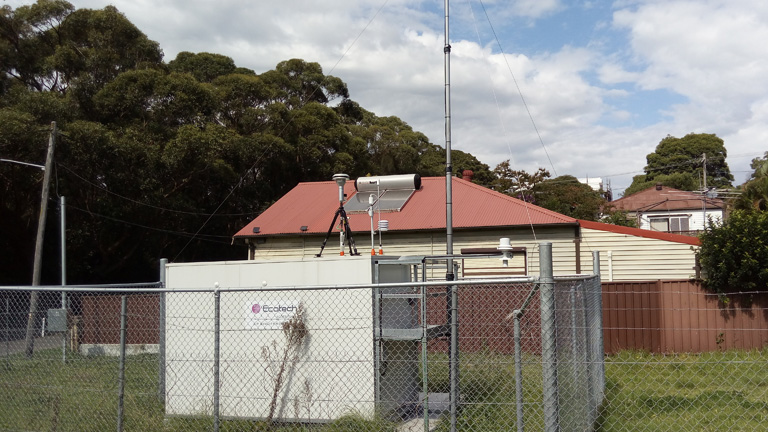
Eve Street has the second monitoring station. It is not a very good site because it is well outside the zone of highest exposure.
| Month | PM2.5 monthly average, μg/m3 (yearly allowed average is 8) | PM2.5 highest 24 hours period, μg/m3 (allowed is 25) | PM2.5 annual average to here where reported, μg/m3 (allowed average is 8) | PM10 monthly average, μg/m3 (yearly allowed average is 25) | PM10 highest 24 hours period, μg/m3 (allowed is 50) | PM10 annual average to here where reported, μg/m3 (allowed average is 25) |
|---|---|---|---|---|---|---|
| January, 2019 | 9.2 | 27.3 | ||||
| February, 2019 | 7.5 | 22.4 | ||||
| March, 2019 | 9.1 | 21.2 | ||||
| April, 2019 | 8.3 | 27 | 18.6 | |||
| May, 2019 | 12.2 | 39 | 20.5 | |||
| June, 2019 | 9.5 | 25 | 12.8 | |||
| July, 2019 | 8.1 | 13.7 | ||||
| August, 2019 | 7.9 | 16.1 | ||||
| September, 2019 | 7.7 | 18.5 | ||||
| October, 2019 | 12.5 | 64 | 23.7 | 73.2 | ||
| November, 2019 | 22.2 | 62.5 | 37.5 | 109.2 | ||
| December, 2019 | 27.0 | 82.4 | 42.3 | 120.5 | ||
| January, 2020 | 28.1 | 56.8 | 13.3 | 37.7 | 79.1 | |
| February, 2020 | 12.7 | 26.0 | 13.8 | 18.8 | 26.0 | |
| March, 2020 | 11.4 | 14.8 | 17.1 | |||
| April, 2020 | 12.4 | 20.5 | ||||
| May, 2020 | 8.3 | 13.5 | ||||
| June, 2020 | 8.2 | 13.3 | ||||
| July, 2020 | 10.2 | 26.2 | 13.0 | |||
| August, 2020 | 8.6 | 13.3 | ||||
| September, 2020 | 8.2 | 15.5 | ||||
| October, 2020 | 8.7 | 35.6 | 15.3 | |||
| November, 2020 | 10.2 | 18.7 | ||||
| December, 2020 | 9.7 | 16.8 | ||||
| January, 2021 | 9.7 | 17.6 | ||||
| February, 2021 | 8.4 | 15.5 | ||||
| March, 2021 | 6.3 | 16.3 | ||||
| April, 2021 | 8.2 | 28.9 | 17.3 | |||
| May, 2021 | 7.3 | 32.9 | 13.4 | |||
| June, 2021 | 7.0 | 12.8 | ||||
| July, 2021 | 5.9 | 12.0 | ||||
| August, 2021 | 7.0 | 25.8 | 12.7 | |||
| September, 2021 | 5.3 | 12.9 | ||||
| October, 2021 | 5.8 | 14.8 |
| Daily Target Exceedances | ||
|---|---|---|
| Reason in reports | Pollutant | Days |
| Unidentified regional event | PM2.5 | 10/7/2020 |
| Hazard reduction burning | PM2.5 | 3/7/2020, 27/4/2021, 3/5/2021, 22/8/2001 |
| Reason not given nor required to be given | PM2.5 | 29/4/2019, 20/5/2019, 21/5/2019, 24/05/2019, 30/10/2019, 31/10/2019, 1/11/2019, 2/11/2019, 3/11/2019, 11/11/2019, 12/11/2019, 19/11/2019, 21/11/2019, 22/11/2019, 25/11/2019, 26/11/2019, 28/11/2019, 29/11/2019, 30/11/2019, 2/12/2019, 3/12/2019, 4/12/2019, 5/12/2019, 6/12/2019, 7/12/2019, 10/12/2019, 19/12/2019, 21/12/2019, 31/12/2019, 1/1/2020, 2/1/2020, 4/1/2020, 5/1/2020, 11/1/2020, 12/1/2020, 16/1/2020, 17/1/2020, 23/1/2020, 24/1/2020, 27/1/2020, 29/1/2020 2/2/2020 |
| Reason not given nor required to be given | PM10 | 30/10/2019, 31/10/2019, 1/11/2019, 12/11/2019, 19/11/2019, 21/11/2019, 26/11/2019, 28/11/2019, 29/11/2019, 2/12/2019, 3/12/2019, 4/12/2019, 5/12/2019, 6/12/2019, 10/12/2019, 19/12/2019, 21/12/2019, 31/12/2019, 1/1/2020, 4/1/2020, 5/1/2020, 12/1/2020, 23/1/2020, 24/1/2020, 25/1/2020, 2/2/2020 |
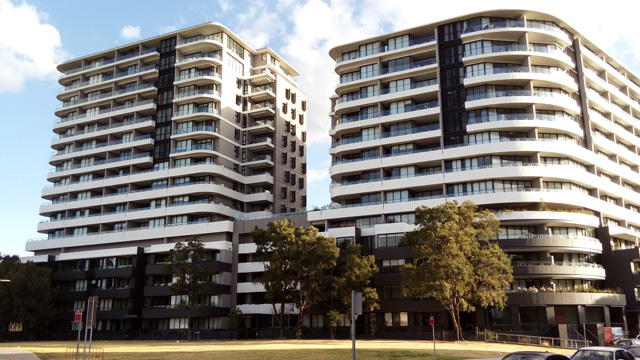
Between Marsh Street and the Cooks River is a cluster of high rise buildings, quite close to the smokestack, of which the tallest is 16 storeys and must be well over 40 meters high. That building is on the left in the picture below. That building, and probably some of the others as well, is taller than the smokestack which will only be 35 meters high. Even though the exhaust plume from the stack will rise, I imagine that on the edges, some of it will shear off and go wherever the wind takes it.
I am convinced that the residents near the top of those buildings will experience the greatest increases in air pollution. However, being higher up, they will have less pollution from street level sources. Whether that will bring their total above the targets, I am not able to say.
The WestConnex funded monitoring stations are to be at ground level, according to the approval conditions. So, I don't expect that WestConnex will fund a monitoring station on top of any high rise building, even if access and power can be negotiated. However, neither the approval conditons nor the national standard on which the approval conditions are based say that the air quality targets only apply at ground level. It may be an option for the residents to fund their own expert advice and, depending on what the experts say, air quality monitoring.