There are eight air quality monitoring stations, two for each smokestack, one for the St Peters interchange and one more in another locations for comparison. See Approval Conditions, Section E10. Monitoring is taking place for one year before the new M5 opens and for two years after. In other words, from early 2019 to early 2022. Obviously, the locations of the two monitoring stations for each smokestack are critical because we need them where exposure to emissions is highest and where they will show if the air quality is worse than what was modelled. The committee has input in the locations of the monitoring stations.
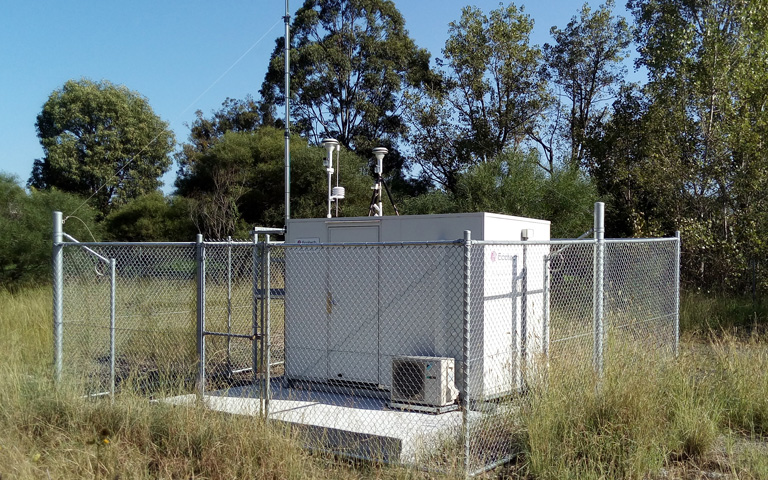
Below is a picture of an air quality monitoring station to give you an idea of the visual impact.
The air quality expert at our very first meeting said a few things about the air quality monitoring stations:
Although I don't recall the air quality expert saying it, the presentation document in my possession states that Nitrogen Oxides, Hydrocarbons and Ozone will also be measured
I have here the monitoring results evaluation for PM2.5. Levels are in micro-grams per cubic meter and the maximum allowable annual level is 8.
The idea is to compare before and after figures for the air quality monitoring stations near the stacks and also for the background locations and see how air quality near the stacks changed relative to the background locations.
Problem 1: We have figures for the year preceding the opening. However, in that year construction took place which generated its own pollution. So comparing against that year is pointless. However, there was also a monitoring program in 2015/2016 as part of the process to kick the project off. So I am using those data.
Problem 2: The air quality monitoring stations are not all in the same places in the new program and in the 2015/2016 program. I can only do this for the stations which are in the same location. That means three near the stacks and the background location.
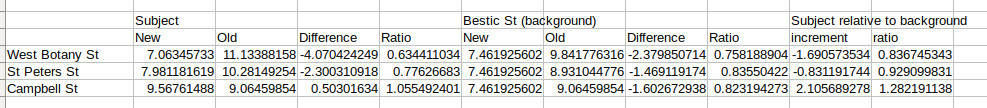
So, I have four figures for each subject (air quality monitoring station near stack). The new figure is the average, adjusted for length of months, for August 2020 to October, 2021, the full months for which I have figures. The old figures are a similar average for the 2015/2016 program. Then I take the difference and the ratio.
I have a similar set of four figures for the background location. Note that the old figure varies. That is because we don't have the same set of months for all subjects, so for each subject I average the background figure for the same months.
Then I do a difference of the differences and a ratio of the ratios for each subject against the background location to get a feel for the relative improvement or worsening. A negative difference and ratio smaller than one means air quality improved more or got worse less than at the subject than at the background location. A positive difference and ratio greater than one means the subject improved less or got worse more than the background location.
I have figures for August 2020 to May 2021. On the figures so far, West Botany Street in Arncliffe has improved PM2.5 figures. West Botany St improved significantly more than the background location in Bestic Street. I believe this improvement is explained by a fall in air travel during the pandemic, especially international air travel. West Botany Street is close to International Airport and Airport Drive and so its air quality benefitted from decreased road traffic to and from the airport. Campbell Street has worse PM2.5 figures, even though the background location has improved figures. St Peters Street improved somewhat more than Bestic Street. I have nothing for Kingsgrove because none of the air quality monitoring stations there are in the same place.
Before construction on the New M5 started, there was an air quality monitoring program to get some air quality baseline figures for the proposed stacks. All of the monitoring stations for this program have been decommissioned, mostly before construction started, except for St Peters Public School for which we have results under the old program until September 2018. In December, new monitoring stations were installed, some of which in the same locations as in the old program and some elsewhere.
I have gone through the reports and compiled pollution figures in a form that is hopefully easy to understand. The data can be found in the following sections:
The original monthly reports can be found on the WestConnex Air Quality site. Most are under the New M5 section. Some of the later reports in the old program for St Peter Public School appear in the M4-M5 Link section.
In all the tables with pollution figures, I highlighted everything of concern. I am using the national air quality standard as a yardstick of whether we should be concerned or not. This standard is also reflected in the approval conditions. I am using the following conventions for highlighting reasons for concern:
| Monthly average is higher than yearly target average | For any one month, such an occurrence is NOT a breach of the national air quality standard. But a pattern of such occurrences can lead us to conclude that the yearly target has also been breached. |
| Exceedance | For yearly targets, this is based on the available monthly data. We don't always have a full 12 months. And in any case, looking at the reports, there are often quite a few days missing within months. But the pattern of high monthly figures is often such that it is obvious that the yearly target was also exceeded. For daily exceedances, I have gone through the reports to see what reason was given. In some cases, the reports speculate on regional events without saying what the event was, based on higher readings at multiple sites. I am still counting those exceedances as genuine, because the regional event could have been adverse weather in which road-based pollutants do not disperse as readily as on other days. That would still amount to road-based pollution causing the exceedance. I am counting road construction as road-based pollution. The project team considers it important to make a distinction between air quality problems caused by the tunnels and air quality problems caused by other road based pollution. For me what is important is road based pollution. |
| Probable Exceedance | For yearly targets, where the monthly data don't cover a whole year, the average of those months is over the yearly target average but not by enough to say that the exceedance of the yearly target is obvious. |
| Excused Exceedance | This covers exceedances that are explained by non-road sources. In all cases, this was hazard reduction burning or bush fire. |
| Exceedance does not require explanation | For exceedances in the year before the New M5 opens. RMS/SMC/WestConnex are not required to explain such exceedances. |
I have based the information on the monthly reports. There are some differences in the information which is available in the reports for the old and for the new monitoring program. The old reports always gave the maximum 24 or eight hour period (depending on the pollutant) reading for the month. The new reports generally only reports exceedances instead of maximums (with the exception of some values being reported as exceedances which are equal to the allowable maximum and therefore, by my reading, not exceedances). That is why there are empty cells in the tables for the new program. For CO (Carbon Monoxide) and NO2 (Nitrogen Dioxide) there hasn't been a single exceedance in the new or the old program, so I left the columns out for the new program because there is no point in having columns containing just a header and otherwise empty cells.