The monitoring results and the colour coding of result are explained in the Air Quality Monitoring for the New M5 section.
Below is a picture of the St Peters tunnel, smokestack and interchange situation. To avoid issues with WestConnex copyright, I drew it with Microsoft Paint onto a Google satellite image. For the original WestConnex map, go to https://www.westconnex.com.au/map.
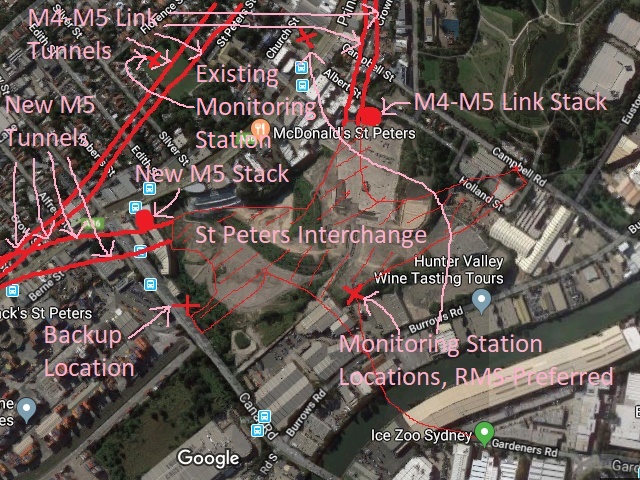
It turns out that there are actually two smokestacks planned for St Peters. But the one that is closer to Sydney Park is obviously for the M4-M5 Link and therefore out of scope for the New M5 AQCCC.
St Peters is interesting, especially as their New M5 smokestack will be only 20m high. Presumably this is because the land there is relatively flat, although high rise buildings are coming to that area also.
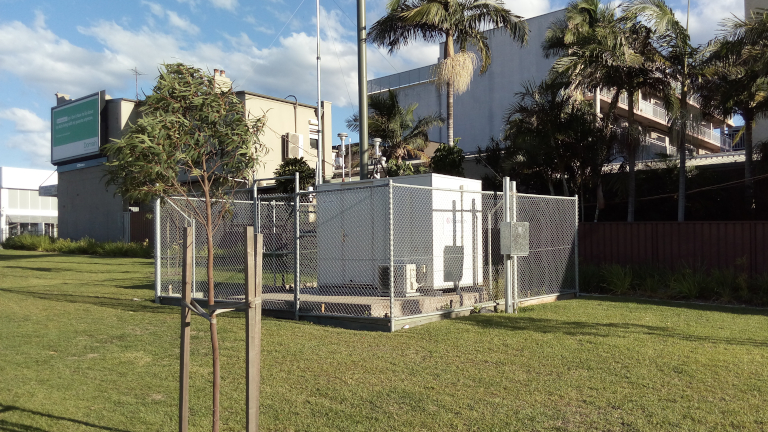
This is not the best possible location for picking up pollution from the New M5 St Peter smoke stack because it is too far from the zones of greatest impact. However, it is unique amongst the New M5 monitoring stations because air quality is being monitored there continuously except for a three months gap.
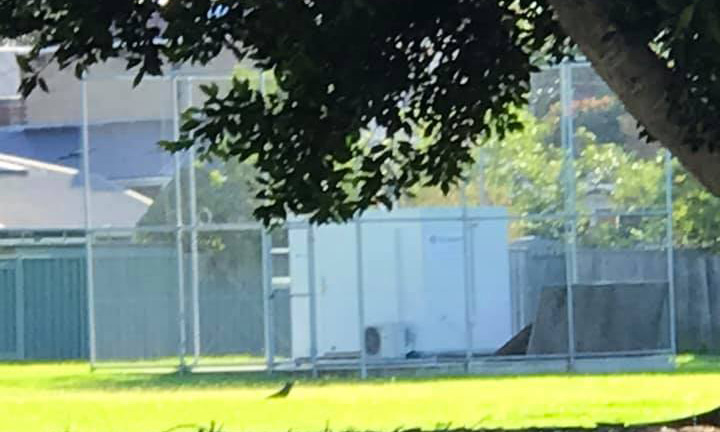
Thank you to the contributor who took the above photo of the St Peters Public School monitoring station for me.
| Month | PM2.5 monthly average, μg/m3 (yearly allowed average is 8) | PM2.5 highest 24 hours period, μg/m3 (allowed is 25) | PM2.5 annual average to here where reported, μg/m3 (allowed average is 8) | PM10 monthly average, μg/m3 (yearly allowed average is 25) | PM10 highest 24 hours period, μg/m3 (allowed is 50) | PM10 annual average to here where reported, μg/m3 (allowed average is 25) |
|---|---|---|---|---|---|---|
| January, 2019 | 14.6 | 29.1 | 54.9 | |||
| February, 2019 | 10.4 | 24.8 | ||||
| March, 2019 | 8.6 | 22.3 | ||||
| April, 2019 | 12.3 | 37 | 22 | |||
| May, 2019 | 13.3 | 35 | 21.3 | |||
| June, 2019 | 11.8 | 31 | 16.8 | |||
| July, 2019 | 10.0 | 19.7 | ||||
| August, 2019 | 12.5 | 20.4 | ||||
| September, 2019 | 11.8 | 19.8 | ||||
| October, 2019 | 15.2 | 63 | 26.3 | 76.5 | ||
| November, 2019 | 22.7 | 61.9 | 39.0 | 115.5 | ||
| December, 2019 | 28.4 | 100.0 | 41.1 | 131.4 | ||
| January, 2020 | 26.6 | 51.9 | 15.3 | 39.9 | 77.3 | 26.1 |
| February, 2020 | 13.6 | 15.6 | 21.0 | 25.8 | ||
| March, 2020 | 9.0 | 15.6 | 18.9 | 25.5 | ||
| April, 2020 | 10.3 | 19.7 | ||||
| May, 2020 | 10.6 | 16.3 | ||||
| June, 2020 | 10.8 | 25.5 | 16.0 | 58.8 | ||
| July, 2020 | 12.2 | 28.1 | 17.3 | |||
| August, 2020 | 10.0 | 15.4 | ||||
| September, 2020 | 9.8 | 18.0 | ||||
| October, 2020 | 11.6 | 32.8 | 17.9 | |||
| November, 2020 | 13.7 | 21.8 | ||||
| December, 2020 | 13.0 | 17.4 | ||||
| January, 2021 | 9.6 | 17.9 | ||||
| February, 2021 | 7.4 | 17.2 | ||||
| March, 2021 | 6.8 | 17.6 | ||||
| April, 2021 | 9.1 | 26.9 | 19.2 | |||
| May, 2021 | 7.0 | 31.1 | 15.8 | |||
| June, 2021 | 5.7 | 14.0 | ||||
| July, 2021 | 4.0 | 13.9 | ||||
| August, 2021 | 5.8 | 36.6 | 15.2 | |||
| September, 2021 | 2.8 | 16.2 | ||||
| October, 2021 | 3.4 | 17.6 |
| Daily Target Exceedances | ||
|---|---|---|
| Reason in reports | Pollutant | Days |
| Unidentified regional event | PM2.5 | 10/7/2020, 25/7/2020 |
| Hazard reduction burning | PM2.5 | 3/10/2020, 27/4/2021, 3/5/2021, 4/5/2021, 21/8/2021, 22/8/2021 |
| Reason not given nor required to be given | PM2.5 | 29/4/2019, 21/5/2019, 22/5/2019, 24/5/2019, 9/6/2019, 25/10/2019, 30/10/2019, 31/10/2019, 1/11/2019, 2/11/2019, 3/11/2019, 11/11/2019, 12/11/2019, 19/11/2019, 21/11/2019, 22/11/2019, 25/11/2019, 26/11/2019, 28/11/2019, 29/11/2019, 2/12/2019, 3/12/2019, 4/12/2019, 5/12/2019, 6/12/2019, 7/12/2019, 10/12/2019, 19/12/2019, 21/12/2019, 31/12/2019, 1/1/2020, 2/1/2020, 4/1/2020, 5/1/2020, 11/1/2020, 12/1/2020, 16/1/2020, 17/1/2020, 24/1/2020, 29/1/2020, 6/6/2020 |
| PM10 | 31/1/2019, 2/8/2019, 7/8/2019, 8/8/2019, 9/8/2019, 15/8/2019, 16/8/2019, 17/8/2019, 19/8/2019, 21/8/2019, 22/8/2019, 24/8/2019, 4/10/2019, 24/10/2019, 25/10/2019, 26/10/2019, 30/10/2019, 31/10/2019, 12/11/2019, 19/11/2019, 21/11/2019, 26/11/2019, 29/11/2019, 2/12/2019, 3/12/2019, 4/12/2019, 5/12/2019, 6/12/2019, 10/12/2019, 19/12/2019, 21/12/2019, 31/12/2019, 4/1/2020, 5/1/2020, 11/1/2020, 12/1/2020, 23/1/2020, 24/1/2020, 25/1/2020, 5/6/2020 | |
| Month | PM2.5 monthly average, μg/m3 (yearly allowed average is 8) | PM2.5 highest 24 hours period, μg/m3 (allowed is 25) | PM10 monthly average, μg/m3 (yearly allowed average is 25) | PM10 highest 24 hours period, μg/m3 (allowed is 50) | Highest CO rolling 8 hour average, ppm (allowed is 9) | Highest NO2 hourly average, ppb (allowed is 120) |
|---|---|---|---|---|---|---|
| July, 2015 | The report states: "There is no reporting data for the St Peters Public School monitoring site since the site was only commissioned on 14 July 2015, part way into this reporting period." | |||||
| August, 2015 | 13.6 | 34.5 | 21.8 | 47.3 | 1.0 | 31.0 |
| September, 2015 | 9.3 | 15.6 | 25.3 | 43.6 | 0.7 | 28.0 |
| October, 2015 | 12.2 | 18.1 | 29.4 | 46.0 | 0.6 | 38.6 |
| November, 2015 | 10.0 | 20.7 | 27.6 | 50.1 | 0.6 | 33.2 |
| December, 2015 | 14.5 | 19.0 | 25.1 | 33.7 | 0.7 | 20 |
| January, 2016 | 8.9 | 19.1 | 19.0 | 32.2 | 0.5 | 40.7 |
| February, 2016 | 5.2 | 9.7 | 19.9 | 48.2 | 0.6 | 18.5 |
| March, 2016 | 9.5 | 17.8 | 16.2 | 33.3 | 0.9 | 23.8 |
| April, 2016 | 8.6 | 17.9 | 21.7 | 33.8 | 0.9 | 26.3 |
| May, 2016 | 12.8 | 40.9 | 23.4 | 56.4 | 1.6 | 33.4 |
| June, 2016 | 8.0 | 15.8 | 14.1 | 25.7 | 1.9 | 31.8 |
| July, 2016 | 9.3 | 20.3 | 15.4 | 32.3 | 1.9 | 30.4 |
| August, 2016 | 9.3 | 18.5 | 16.9 | 28.4 | 1.4 | 28.7 |
| September, 2016 | 7.9 | 13.1 | 15.2 | 28.3 | 0.5 | 24.2 |
| October, 2016 | 8.2 | 21.3 | 19.5 | 52.2 | 0.5 | 24.0 |
| November, 2016 | 8.2 | 13.7 | 24.7 | 42.0 | 0.7 | 34.8 |
| December, 2016 | 10.3 | 15.7 | 24.4 | 35.8 | 0.7 | 40.0 |
| January, 2017 | 11.6 | 18.5 | 28.2 | 45.4 | 0.4 | 51.9 |
| February, 2017 | 5.8 | 11.7 | 23.1 | 49.2 | 0.4 | 38.6 |
| March, 2017 | 6.5 | 16.6 | 21.4 | 42.7 | 0.6 | 31.4 |
| April, 2017 | 14.4 | 20.0 | 22.0 | 34.9 | 0.8 | 37.6 |
| May, 2017 | 14.2 | 25.3 | 25.5 | 39.9 | 1.0 | 48.4 |
| June, 2017 | 17.2 | 25.9 | 26.0 | 33.8 | 1.2 | 44.5 |
| July, 2017 | 9.2 | 15.7 | 19.8 | 29.5 | 1.7 | 52.3 |
| August, 2017 | 8.5 | 55.9 | 24.8 | 72.8 | 1.1 | 49.6 |
| September, 2017 | 8.1 | 23.3 | 28.7 | 55.9 | 0.8 | 51.4 |
| October, 2017 | 6.2 | 10.5 | 29.2 | 44.0 | 0.6 | 46.3 |
| November, 2017 | 5.3 | 8.9 | 20.3 | 30.0 | 1.8 | 29.6 |
| December, 2017 | 7.9 | 16.9 | 27.8 | 52.8 | 0.7 | 65.2 |
| January, 2018 | 7.1 | 14.2 | 31.2 | 82.0 | 0.4 | 28.5 |
| February, 2018 | 7.2 | 13.2 | 28.2 | 60.3 | 0.5 | 29.0 |
| March, 2018 | 10.2 | 19.3 | 30.9 | 66.9 | 0.6 | 47.3 |
| April, 2018 | 12.2 | 22.3 | 32.7 | 55.5 | 0.7 | 41.1 |
| May, 2018 | 13.5 | 39.5 | 29.7 | 56.7 | 1.3 | 43.9 |
| June, 2018 | 7.8 | 14.9 | 14.2 | 22.2 | 1.0 | 40.1 |
| July, 2018 | 9.7 | 17.9 | 22.1 | 48.1 | 1.1 | 56.1 |
| August, 2018 | 7.9 | 19.4 | 18.4 | 30.3 | 1.1 | 37.9 |
| September, 2018 | 11.2 | 17.1 | 28.3 | 53.9 | 0.9 | 43.4 |
| Daily Target Exceedances | ||
|---|---|---|
| Reason in reports | Pollutant | Days |
| Unspecified regional event | PM10 | 26/11/2015, 20/12/2017 |
| Unspecified local event | PM2.5 | 11/5/2017 |
| PM10 | 8/10/2016, 15/1/2017, 16/1/2017, 4/3/2018, 20/3/2018, 19/9/2018 | |
| Cold weather, resulting in "possible" (but unverified) emissions from wood heaters | PM2.5 | 28/6/2017 |
| Construction | PM10 | 27/4/2018 |
| Hazard reduction burning | PM2.5 | 21/8/2015, 20/5/2016, 23/5/2016 |
| PM10 | 23/5/2016 | |
| Hazard reduction burning and/or bushfire | PM2.5 | 14/8/2017, 14/4/2018, 27/5/2018 |
| PM10 | 14/8/2017, 24/9/2017, 8/5/2018, 27/5/2018, 29/5/2018 | |
| Bushfire | PM10 | 15/2/2018, 16/2/2018, 19/3/2018 |
This is not a very good location for picking up exceedances from the New M5 stack, based on the modelling provided. However, there will also be a stack nearby for the M4-M5 Link, it is reasonably close to the interchange, it is elevated and it will close to two busy roads, Princes Highway and Campbell Street (which I am sure will get a lot busier when WestConnex is fully operational). So in terms of picking up total WestConnex pollution exposure and total traffic exposure (WestConnex plus unchanged regular roads), the location is quite good, I think. However, the Westconnex New M5 Instrument of Approval, section E17, requires consideration to improvements only if operation of the (New M5) tunnel is a "significant contributor" to exceedances. If the combined effect of WestConnex (New M5 tunnel plus M4-M5 Link tunnel plus interchange plus widened roads in the neighbourhood) is a significant contributor to exceedances, this does not mean that the New M5 tunnel is a significant contributor. And even if it is, that will be quite tricky to prove.
| Month | PM2.5 monthly average, μg/m3 (yearly allowed average is 8) | PM2.5 highest 24 hours period, μg/m3 (allowed is 25) | PM2.5 annual average to here where reported, μg/m3 (allowed average is 8) | PM10 monthly average, μg/m3 (yearly allowed average is 25) | PM10 highest 24 hours period where reported, μg/m3 (allowed is 50) | PM10 annual average to here, μg/m3 (allowed average is 25) |
|---|---|---|---|---|---|---|
| January, 2019 | 14.6 | 31.3 | 50.4 | |||
| February, 2019 | 10.2 | 27.8 | 63.0 | |||
| March, 2019 | 10.9 | 25.4 | 55.5 | |||
| April, 2019 | 12.0 | 37 | 26.3 | 54.9 | ||
| May, 2019 | 13.4 | 35 | 33.5 | 70.8 | ||
| June, 2019 | 10.9 | 27 | 19.4 | |||
| July, 2019 | 10.2 | 27.4 | 65.2 | |||
| August, 2019 | 10.0 | 28.6 | 63.0 | |||
| September, 2019 | 9.7 | 28.0 | ||||
| October, 2019 | 14.5 | 68 | 36.8 | 100.3 | ||
| November, 2019 | 24.0 | 65.8 | 48.4 | 117.7 | ||
| December, 2019 | 27.5 | 68.8 | 51.5 | 149.3 | ||
| January, 2020 | 26.5 | 53.8 | 15.0 | 46.1 | 88.5 | 33.3 |
| February, 2020 | 10.7 | 15.0 | 26.9 | 51.2 | 33.2 | |
| March, 2020 | 9.2 | 14.9 | 24.9 | 60.3 | 33.2 | |
| April, 2020 | 13.0 | 24.4 | ||||
| May, 2020 | 12.2 | 21.1 | ||||
| June, 2020 | 13.1 | 28.3 | 20.4 | 55.3 | ||
| July, 2020 | 12.7 | 28.2 | 20.3 | |||
| August, 2020 | 10.7 | 25.5 | 18.3 | |||
| September, 2020 | 10.0 | 20.9 | ||||
| October, 2020 | 10.3 | 32.7 | 19.4 | |||
| November, 2020 | 12.1 | 23.5 | ||||
| December, 2020 | 12.0 | 21.1 | ||||
| January, 2021 | 10.7 | 19.6 | ||||
| February, 2021 | 11.6 | 20.9 | ||||
| March, 2021 | 7.8 | 20.0 | ||||
| April, 2021 | 10.2 | 29.0 | 21.6 | |||
| May, 2021 | 9.0 | 30.5 | 16.6 | |||
| June, 2021 | 8.9 | 15.9 | ||||
| July, 2021 | 7.7 | 14.7 | ||||
| August, 2021 | 9.6 | 43.0 | 18.7 | 50.4 | ||
| September, 2021 | 6.3 | 16.9 | ||||
| October, 2021 | 6.8 | 18.7 |
| Daily Target Exceedances | ||
|---|---|---|
| Reason in reports | Pollutant | Days |
| Unidentified local event | PM10 | 16/8/2021 |
| Unidentified regional event | PM2.5 | 10/7/2020, 24/7/2020, 25/7/2020, 2/8/2020 |
| Hazard reduction | PM2.5 | 3/10/2020, 30/8/2020, 27/4/2021, 3/5/2021, 4/5/2021, 21/8/2021, 22/8/2021 |
| Reason not given nor required to be given | PM2.5 | 29/4/2019, 20/5/2019, 21/5/2019, 22/5/2019, 24/5/2019, 25/10/2019, 30/10/2019, 31/10/2019, 1/11/2019, 2/11/2019, 3/11/2019, 11/11/2019, 12/11/2019, 19/11/2019, 21/11/2019, 22/11/2019, 25/11/2019, 26/11/2019, 28/11/2019, 29/11/2019, 30/11/2019, 2/12/2019, 3/12/2019, 4/12/2019, 5/12/2019, 6/12/2019, 7/12/2019, 10/12/2019, 19/12/2019, 21/12/2019, 31/12/2019, 1/1/2020, 2/1/2020, 4/1/2020, 5/1/2020, 11/1/2020, 12/1/2020 16/1/2020, 17/1/2020, 24/1/2020, 29/1/2020, 6/6/2020 |
| PM10 | 31/1/2019, 12/2/2019, 13/2/2019, 19/2/2019, 6/3/2019, 11/3/2019, 29/4/2019, 17/5/2019, 20/5/2019, 21/5/2019, 22/5/2019, 24/5/2019, 9/6/2019, 2/7/2019, 19/7/2019, 22/7/2019, 8/82019, 15/8/2019, 4/10/2019, 24/10/2019, 25/10/2019, 26/10/2019, 30/10/2019, 31/10/2019, 1/11/2019, 2/11/2019, 7/11/2019, 12/11/2019, 15/11/2019, 19/11/2019, 21/11/2019, 22/11/2019, 26/11/2019, 28/11/2019, 29/11/2019, 2/12/2019, 3/12/2019, 4/12/2019, 5/12/2019, 6/12/2019, 7/12/2019, 10/12/2019, 13/12/2019, 16/12/2019, 19/12/2019, 21/12/2019, 31/12/2019, 4/1/2020, 5/1/2020, 11/1/2020, 12/1/2020, 23/1/2020, 24/1/2020, 25/1/2020, 29/1/2020, 28/2/2020, 2/3/2020, 27/3/2020, 18/6/2020 | |
| Month | PM2.5 monthly average, μg/m3 (yearly allowed average is 8) | PM2.5 highest 24 hours period, μg/m3 (allowed is 25) | PM10 monthly average, μg/m3 (yearly allowed average is 25) | PM10 highest 24 hours period, μg/m3 (allowed is 50) | Highest CO rolling 8 hour average, ppm (allowed is 9) | Highest NO2 hourly average, ppb (allowed is 120) |
|---|---|---|---|---|---|---|
| July, 2015 | 13.8 | 24.2 | 19.0 | 30.5 | 1.6 | 42.0 |
| August, 2015 | 10.8 | 14.6 | 16.3 | 20.8 | 1.0 | 41.0 |
| September, 2015 | 11.5 | 15.4 | 24.0 | 39.2 | 1.0 | 43.0 |
| October, 2015 | 14.0 | 18.9 | 31.5 | 54.1 | 0.7 | 60.2 |
| November, 2015 | 13.1 | 21.3 | 28.3 | 52.3 | 0.6 | 60.8 |
| December, 2015 | PM 2.5 and PM10 figures are identical to the figures for West Botany Street, Arncliffe. After analysis of the graphs in the report, I concluded that the figures for West Botany Street were copied to the Princes Highway summary by mistake. | |||||
| January, 2016 | 8.5 | 15.0 | 20.7 | 36.1 | 0.6 | 54.8 |
| February, 2016 | 6.9 | 10.9 | 22.6 | 37.9 | 0.5 | 51.4 |
| March, 2016 | 6.4 | 12.8 | 19.0 | 37.3 | 0.8 | 42.6 |
| April, 2016 | 8.5 | 15.3 | 20.9 | 32.7 | 1.0 | 54.2 |
| Daily Target Exceedances | ||
|---|---|---|
| Reason in reports | Pollutant | Days |
| Unspecified regional event | PM10 | 7/10/2015, 26/11/2015 |
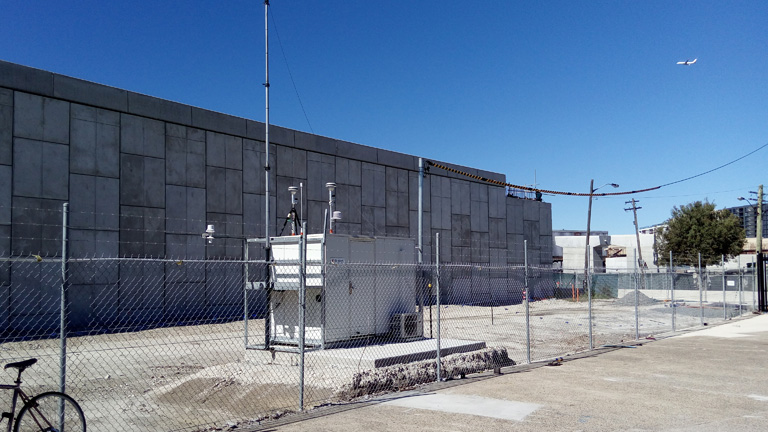
This location is on the outside of the interchange and therefore not the best possible location for picking up pollution from the interchange. On the other hand, it is quite close to people's work places on Burrows Road. Therefore, we should take exceedances at this station seriously.
| Month | PM2.5 monthly average, μg/m3 (yearly allowed average is 8) | PM2.5 highest 24 hours period, μg/m3 (allowed is 25) | PM2.5 annual average to here where reported, μg/m3 (allowed average is 8) | PM10 monthly average, μg/m3 (yearly allowed average is 25) | PM10 highest 24 hours period, μg/m3 (allowed is 50) | PM10 annual average to here where reported, μg/m3 (allowed average is 25) |
|---|---|---|---|---|---|---|
| January, 2019 | 11.9 | 41.5 | 82.0 | |||
| February, 2019 | 10.3 | 40.2 | 90.9 | |||
| March, 2019 | 11.2 | 35.9 | 79.5 | |||
| April, 2019 | 12.5 | 38 | 34.7 | 88.9 | ||
| May, 2019 | 15.0 | 41 | 49.3 | 120.7 | ||
| June, 2019 | 11.3 | 26.7 | 96.8 | |||
| July, 2019 | 10.8 | 38.1 | 90.4 | |||
| August, 2019 | 10.2 | 39.3 | 84.1 | |||
| September, 2019 | 7.7 | 31.6 | 94.1 | |||
| October, 2019 | 12.6 | 62 | 45.1 | 96.2 | ||
| November, 2019 | 21.2 | 62.6 | 61.6 | 144.7 | ||
| December, 2019 | 25.0 | 79.9 | 58.5 | 156.3 | ||
| January, 2020 | 24.8 | 53.2 | 14.4 | 50.4 | 131.3 | 42.6 |
| February, 2020 | 9.1 | 14.3 | 29.3 | 57.3 | 41.7 | |
| March, 2020 | 7.2 | 14.0 | 24.8 | 54.9 | 40.8 | |
| April, 2020 | 10.1 | 31.9 | 60.5 | |||
| May, 2020 | 8.9 | 25.9 | ||||
| June, 2020 | 9.9 | 23.4 | 58.8 | |||
| July, 2020 | 12.5 | 23.2 | ||||
| August, 2020 | 11.7 | 25.5 | 21.7 | 58.2 | ||
| September, 2020 | 8.5 | 22.4 | 51.4 | |||
| October, 2020 | 8.0 | 27.5 | 19.5 | |||
| November, 2020 | 8.5 | 23.1 | ||||
| December, 2020 | 9.5 | 19.8 | ||||
| January, 2021 | 7.3 | 19.8 | ||||
| February, 2021 | 5.7 | 18.8 | ||||
| March, 2021 | 5.5 | 17.6 | ||||
| April, 2021 | 9.3 | 27.8 | 19.2 | |||
| May, 2021 | 7.0 | 32.9 | 15.8 | |||
| June, 2021 | 6.3 | 16.0 | ||||
| July, 2021 | 6.2 | 16.6 | ||||
| August, 2021 | 8.6 | 39.0 | 18.9 | |||
| September, 2021 | 5.9 | 18.5 | ||||
| October, 2021 | 5.9 | 19.2 |
| Daily Target Exceedances | ||
|---|---|---|
| Reason in reports | Pollutant | Days |
| Reason not given | PM10 | 31/8/2020, 4/9/2020 |
| Unidentified regional event | PM2.5 | 10/7/2020, 24/7/2020, 25/7/2020 |
| Hazard reduction burning | PM2.5 | 30/8/2020, 3/10/2020, 27/4/2021, 3/5/2021, 4/5/2021, 21/8/2021, 22/8/2021 |
| Reason not given nor required to be given | PM2/5 | 29/4/2019, 20/5/2019, 21/5/2019, 22/5/2019, 24/5/2019, 25/10/2019, 30/10/2019, 31/10/2019, 1//11/2019, 2/11/2019, 3/11/2019, 11/11/2019, 12/11/2019, 19/11/2019 21/11/2019, 22/11/2019, 25/11/2019, 26/11/2019, 28/11/2019, 29/11/2019 2/12/2019, 3/12/2019, 4/12/2019, 5/12/2019, 6/12/2019, 7/12/2019, 10/12/2019, 19/12/2019, 21/12/2019, 31/12/2019, 1/1/2020, 2/1/2020, 4/1/2020, 5/1/2020, 11/1/2020, 12/1/2020, 16/1/2020, 17/1/2020, 24/1/2020, 29/1/2020, 5/6/2020 |
| PM10 | 5/1/2019, 15/1/2019, 16/2/2019, 17/1/2019, 18/1/2019, 22/1/2019, 23/1/2019, 25/1/2019, 31/1/2019, 11/2/2019, 12/2/2019, 13/2/2019, 14/2/2019, 18/2/2019, 19/2/2019, 26/2/2019, 27/2/2019, 4/3/2019, 5/3/2019, 6/3/2019, 8/3/2019, 11/3/2019, 12/3/2019, 26/3/2019/28/3/2019, 29/3/2019, 4/4/2019, 8/4/2019, 9/4/2019, 29/4/2019, 6/5/2019, 7/5/2019, 8/5/2019, 10/5/2019, 15/5/2019, 16/5/2019, 17/5/2019, 20/5/2019, 21/5/2019, 22/5/2019, 23/5/2019, 24/5/2019, 27/5/2019, 11/6/2019, 12/6/2019, 14/6/2019, 2/7/2019, 19/7/2019, 22/7/2019, 23/7/2019, 24/7/2019, 26/7/2019, 2/8/2019, 7/8/2019, 8/8/2019, 9/8/2019, 15/8/2019, 16/8/2019, 17/8/2019, 19/8/2019, 21/8/2019, 22/8/2019, 24/8/2019, 2/10/2019, 3/10/2019, 4/10/2019, 17/10/2019, 19/10/2019 23/10/2019, 25/10/2019, 26/10/2019, 29/10/2019, 30/10/2019, 31/10/2019, 1/11/2019, 2/11/2019, 7/11/2019, 8/11/2019, 11/11/2019, 12/11/2019, 14/11/2019, 15/11/2019, 18/11/2019, 19/11/2019, 22/11/2019, 25/11/2019, 26/11/2019, 28/11/2019, 29/11/2019 2/12/2019, 3/12/2019, 4/12/2019, 5/12/2019, 6/12/2019, 7/12/2019, 9/12/2019, 10/12/2019 18/12/2019, 19/12/2019, 21/12/2019, 31/12/2019, 4/1/2020, 5/1/2020, 10/1/2020, 11/1/2020, 12/1/2020, 15/1/2020, 22/1/2020, 23/1/2020, 24/1/2020, 25/1/2020, 30/1/2020, 31/1/2020, 1/2/2020, 26/2/2020, 27/2/2020, 20/3/2020, 15/4/2020, 22/4/2020, 23/4/2020, 24/4/2020 | |
| Month | PM2.5 monthly average, μg/m3 (yearly allowed average is 8) | PM2.5 highest 24 hours period, μg/m3 (allowed is 25) | PM10 monthly average, μg/m3 (yearly allowed average is 25) | PM10 highest 24 hours period, μg/m3 (allowed is 50) | Highest CO rolling 8 hour average, ppm (allowed is 9) | Highest NO2 hourly average, ppb (allowed is 120) |
|---|---|---|---|---|---|---|
| July, 2015 | 8.9 | 14.6 | 28.1 | 54.5 | 1.7 | 44.2 |
| August, 2015 | 8.9 | 23.7 | 27.2 | 51.3 | 1.1 | 42.6 |
| September, 2015 | 7.4 | 13.6 | 25.1 | 45.8 | 0.8 | 44.8 |
| October, 2015 | 8.8 | 14.5 | 26.1 | 48.7 | 0.8 | 53.2 |
| November, 2015 | 7.7 | 13.2 | 28.6 | 44.7 | 0.6 | 50.0 |
| December, 2015 | 7.4 | 12.8 | 23.9 | 40.0 | 0.8 | 44.2 |
| January, 2016 | 6.3 | 12.9 | 27.1 | 44.7 | 0.6 | 42.2 |
| February, 2016 | 7.9 | 12.0 | 30.4 | 41.6 | 0.6 | 50.0 |
| March, 2016 | 6.6 | 15.1 | 26.7 | 50.7 | 0.8 | 45.6 |
| April, 2016 | 9.5 | 16.6 | 23.5 | 34.7 | 0.8 | 53.1 |
| Daily Target Exceedances | ||
|---|---|---|
| Reason in reports | Pollutant | Days |
| No reason given | PM10 | 1/7/2015, 2/7/2015, 11/8/2015, 10/3/2015 |
Even before the March 5, 2018 meeting, I had the impression that St Peters was not very well represented at the AQCCC meetings. I only recall one community representative there from St Peters and there are supposed to be three each from St Peters, Arncliffe and Kingsgrove (I am a resident of Rockdale and represent the Arncliffe community at the AQCCC). At the March 5, 2018 meeting, there was no one there for St Peters. No one from City of Sydney, no one from Inner West Council and no community representative. No one at all.
All the monitoring station locations which the project team proposed for the October 17 meeting for the St Peters Stack were outside the area of greatest increase in pollution. In the March 5, 2018 documentation, the project team's preferred locations were at Campbell Street, a little bit west of the Princes Highway and near the eastern edge of the St Peters interchange. A back-up location on Canal Road was also proposed (which wasn't in the documentation for October 17). The Canal Road site, according to the modelling, was more impacted and therefore looked like a better location. At the March 5 meeting, in the absence of anyone formally representing St Peters, I spoke for St Peters and pushed the Canal Road site. The problem is that the so-called Sydney Gateway is being considered and Canal Road site would be affected by construction dust from that project if it goes ahead. SMC says that this could affect readings. So this site has been eliminated.
While the sites that have been selected may not be the best for measuring the increases from the M5 stack, there is going to be pollution from the M4-M5 Link stack, from the interchange itself and from all the extra traffic on the surface roads radiating out from the interchange. I doubt very much that RMS/SMC/WestConnex are going to look at the pollution figures from the air quality monitoring sites and pick apart how much would have been there without WestConnex, how much comes from the M5 stack, how much comes from the M4-M5 Link stack, how much comes from the interchange and how much comes from the surface traffic radiating out. Really, monitoring locations should have been picked based on total WestConnex impact. To the best of my knowledge, no modelling is publicly available for total WestConnex impact on St Peters. But we can't demand from the project team that they model and select monitoring station locations based on total WestConnex impact because the approval conditions for the New M5, and in all probability the approval conditions for the other components of WestConnex, don't specify this.
My gut feeling is that the Campbell Street site, though not ideal for picking up exceedances from the M5 stack, is going to be reasonably good for picking up exceedances from WestConnex as a whole because it is reasonably close to the interchange, it is elevated and it is on a road being widened to radiate traffic out from the interchange. It is also in a residential area. The question is what is going to happen when the site picks up exceedances caused by WestConnex but it can't be demonstrated that the M5 is a significant contributor. The problem is that the approval conditions for the New M5 component of WestConnex, and it is probably equivalent for the other components, only have provision for what happens if the New M5 is a significant contributor to exceedances. And it's going to be tricky, if not impossible, to pick apart the impact from the various components. I suppose if that becomes an issue, the people of St Peters will have to say to RMS/SMC/WestConnex something like: "You picked the site, you were obligated to pick a suitable site for detecting air quality impact of the New M5. You can't now turn around and say we can't tell how much comes from the New M5 and use that as an excuse".
Also, I am half expecting that the RMS/SMC/WestConnex is going to try to reuse the Campbell Street monitoring station as an M4-M5 Link Stack Monitoring Stations. So, watch out for that.
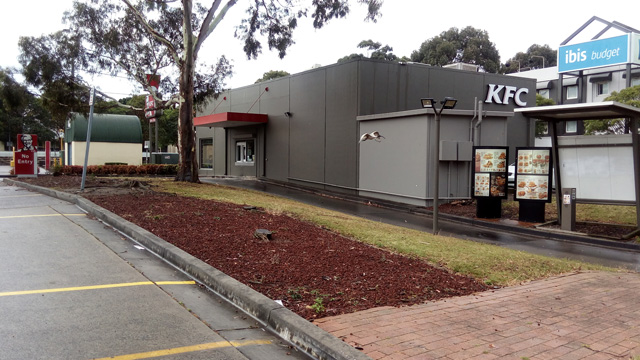
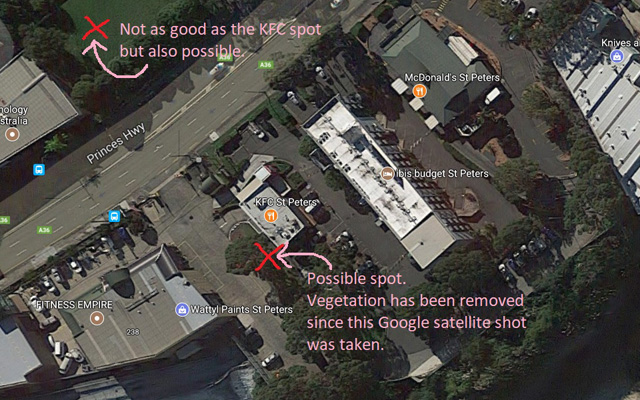
After the October 17 meeting, I studied the maps carefully and came to the conclusion that there probably should be one at the Princes Highway. There is a spot next to the KFC outlet which appears to be suitable. I proposed that spot to the AQCCC organisers on October 22. At the March 5 meeting, I mentioned it and was told that there are plans for a bike path there. Unfortunately, it did not occur to me at that moment to ask about the possibility of putting one into the grounds of St Peters Anglican Church across the road.