The monitoring results and the colour coding of result are explained in the Air Quality Monitoring for the New M5 section.
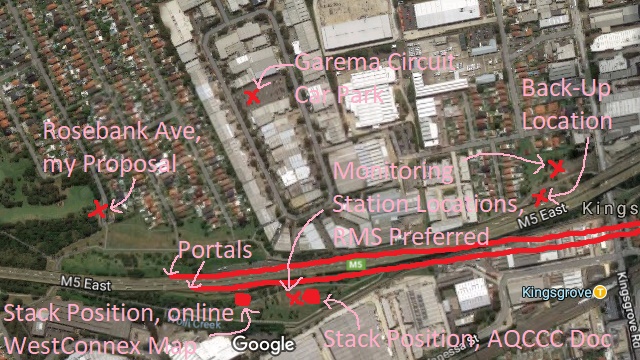
Below is a picture of the Kingsgrove tunnel and smokestack situation. To avoid issues with WestConnex copyright, I drew it with Microsoft Paint onto a Google Maps satellite image. For the original WestConnex map, go to https://www.westconnex.com.au/map.
In Kingsgrove, the smokestack will be 30 meters high. The WestConnex map and the documentation we received for October 17 and March 5 show a discrepancy in stack position.
The project team went ahead with one location right next to the stack and one location in Forrester Reserve near Kingsgrove Road. Kingsgrove would have been better off with monitoring station in Garema Circuit Car Park and Rosebank Avenue. According to the project team, it was difficulties cited by Canterbury-Bankstown Council that caused the Garema Circuit and Rosebank Avenue sites to be eliminated. Unfortunately, there will therefore be no monitoring station on the hill side of the stack where both common sense and the modelling lead us to expect the greatest increases.
The locations that the project team proposed for the air quality monitoring stations for the October 17 meeting were wholly or partly outside the zones of greatest increase in pollution (it sometimes depends on the spot within a site).
The locations of greatest interest were all on the Canterbury-Bankstown side of Kingsgrove.
The pollution modelling information is available here.
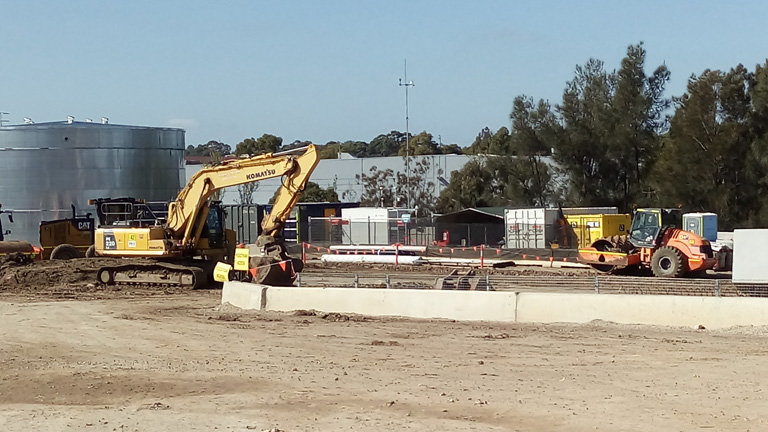
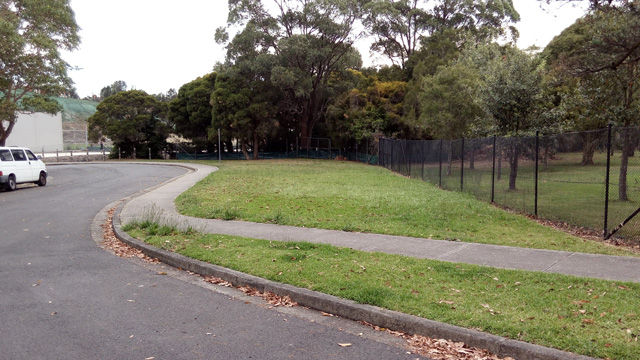
The monitoring station is in the centre of the picture below. There are some sensitivities around unauthorised people such as myself on construction sites, so I only have shots taken from a distance of which this is the best one.
One more note on the location next to the stack: We had been getting mixed messages whether locations next to the stack are suitable for measuring impact from the stack. The air quality expert at the September 19, 2017, meeting had suggested that they are not. But the project team claimed that it was. We quizzed the air quality expert at the September 10, 2018, meeting about this (who is not the same person). What he said, and he backed this up with the modelling diagram, is that locations next to the stack are not very good for picking up one hour pollution spikes. They are much better for picking up 24 hour exceedances and very good at picking up annual exceedances. As you can see in the Existing monitoring results, the problems are with PM2.5 and PM10 exceedances while there is not a single CO or NO2 exceedance anywhere. PM2.5 and PM10 have 24 hour and annual criteria but no hourly criteria. So the unsuitability of the location next to the stack for picking up hourly exceedances is inconsequential.
| Month | PM2.5 monthly average, μg/m3 (yearly allowed average is 8) | PM2.5 highest 24 hours period, μg/m3 (allowed is 25) | PM2.5 annual average to here, μg/m3 (allowed average is 8) | PM10 monthly average, μg/m3 (yearly allowed average is 25) | PM10 highest 24 hours period, μg/m3 (allowed is 50) | PM10 annual average to here, μg/m3 (allowed average is 10) |
|---|---|---|---|---|---|---|
| January, 2019 | 14.1 | 28 | 42.6 | 95.7 | ||
| February, 2019 | 11.4 | 33.7 | 152.8 | |||
| March, 2019 | 12.9 | 33.9 | 110.8 | |||
| April, 2019 | 14.3 | 51 | 34.1 | 110.4 | ||
| May, 2019 | 18.7 | 50 | 48.1 | 181.1 | ||
| June, 2019 | 13.2 | 30 | 21.1 | |||
| July, 2019 | 12.2 | 38.5 | 123.2 | |||
| August, 2019 | 10.7 | 40.9 | 134.6 | |||
| September, 2019 | 10.5 | 41.8 | 131.9 | |||
| October, 2019 | 14.9 | 64 | 49.8 | 122.9 | ||
| November, 2019 | 22.5 | 72.0 | 64.8 | 201.8 | ||
| December, 2019 | 28.4 | 103.0 | 57.7 | 132.0 | ||
| January, 2020 | 24.7 | 114.0 | 16.2 | 46.7 | 167.7 | 42.5 |
| February, 2020 | 9.6 | 16.1 | 20.2 | 41.4 | ||
| March, 2020 | 5.5 | 15.4 | 19.2 | 40.2 | ||
| April, 2020 | 10.4 | 23.3 | ||||
| May, 2020 | 6.2 | 17.1 | ||||
| June, 2020 | 7.7 | 16.6 | ||||
| July, 2020 | 7.8 | 16.6 | ||||
| August, 2020 | 6.5 | 25.6 | 15.6 | |||
| September, 2020 | 6.2 | 18.9 | ||||
| October, 2020 | 5.7 | 16.2 | ||||
| November, 2020 | 6.2 | 19.5 | ||||
| December, 2020 | 3.7 | 16.9 | ||||
| January, 2021 | 6.4 | 16.8 | ||||
| February, 2021 | 7.2 | 14.4 | ||||
| March, 2021 | 7.7 | 16.1 | ||||
| April, 2021 | 11.8 | 37.3 | 20.0 | |||
| May, 2021 | 10.7 | 48.8 | 15.5 | |||
| June, 2021 | 10.0 | 13.8 | ||||
| July, 2021 | 9.6 | 13.7 | ||||
| August, 2021 | 9.6 | 33.9 | 13.7 | |||
| September, 2021 | 7.3 | 13.9 | ||||
| October, 2021 | 8.0 | 15.9 |
| Daily Target Exceedances | ||
|---|---|---|
| Reason in reports | Pollutant | Days |
| Hazard reduction burning | PM2.5 | 30/8/2020, 27/4/2021, 30/4/2021, 3/5/2021, 4/5/2021, 22/8/2021 |
| Reason not given nor required to be given | PM2.5 | 18/1/2019, 22/1/2019, 8/4/2019, 29/4/2019, 20/5/2019, 21/5/2019, 22/5/2019, 24/5/2019, 25/5/2019, 8/6/2019, 25/10/2019, 29/10/2019, 30/10/2019, 31/10/2019, 1/11/2019, 2/11/2019, 11/11/2019, 12/11/2019, 18/11/2019, 19/11/2019, 21/11/2019, 22/11/2019, 25/11/2019, 26/11/2019, 28/11/2019, 29/11/2019, 30/11/2019, 2/12/2019, 4/12/2019, 5/12/2019, 6/12/2019, 7/12/2019, 10/12/2019, 15/12/2019, 19/12/2019, 21/12/2019, 31/12/2019, 1/1/2020, 2/1/2020, 4/1/2020, 5/1/2020, 8/1/2020, 16/1/2020, 17/1/2020, 23/1/2020, 24/1/2020 |
| Reason not given nor required to be given | PM10 | 15/1/2019, 17/1/2019, 18/1/2019, 22/1/2019, 23/1/2019, 25/1/2019, 31/1/2019, 7/2/2019, 12/2/2019, 18/2/2019, 4/3/2019, 5/3/2019, 6/3/2019, 8/3/2019, 12/3/2019, 26/3/2019, 28/3/2019, 29/3/2019, 8/4/2019, 26/4/2019, 29/4/2019, 30/4/2019, 1/5/2019, 2/5/2019, 8/5/2019, 10/5/2019, 20/5/2019, 21/5/2019, 24/5/2019, 27/5/2019, 28/5/2019, 29/5/2019, 1/7/2019, 2/7/2019, 11/7/2019, 12/7/2019, 13/7/2019, 16/7/2019, 17/7/2019, 22/7/2019, 23/7/2019, 7/82019, 8/8/2019, 9/8/2019, 16/8/2019, 19/8/2019, 20/8/2019, 21/8/2019, 22/8/2019, 24/8/2019, 4/9/2019, 6/9/2019, 7/9/2019, 12/9/2019, 16/9/2019, 27/9/2019, 2/10/2019, 3/10/2019, 4/10/2019, 17/10/2019, 19/10/2019, 23/10/2019, 25/10/2019, 26/10/2019, 29/10/2019, 30/10/2019, 31/10/2019, 1/11/2019, 2/11/2019, 5/11/2019, 7/11/2019, 8/11/2019, 11/11/2019, 12/11/2019, 13/11/2019, 14/11/2019, 15/11/2019, 18/11/2019, 19/11/2019, 21/11/2019, 22/11/2019, 25/11/2019, 26/11/2019, 28/11/2019, 29/11/2019, 2/12/2019, 3/12/2019, 4/12/2019, 5/12/2019, 6/12/2019, 7/12/2019, 9/12/2019, 10/12/2019, 18/12/2019, 19/12/2019, 21/12/2019, 31/12/2019, 4/1/2020, 5/1/2020, 8/1/2020, 11/1/2020, 12/1/2020, 22/1/2020, 23/1/2020, 24/1/2020, 25/1/2020 |
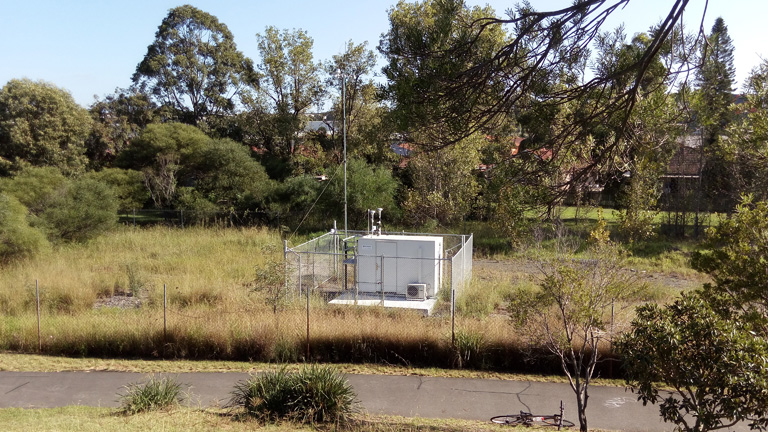
This location is unsatisfactory for picking up exceedances because it is outside the zones of greatest impact. It's not bad for taking nice air quality monitoring station photographs, though.
| Month | PM2.5 monthly average, μg/m3 (yearly allowed average is 8) | PM2.5 highest 24 hours period, μg/m3 (allowed is 25) | PM2.5 annual average to here where reported, μg/m3 (allowed average is 8) | PM10 monthly average, μg/m3 (yearly allowed average is 25) | PM10 highest 24 hours period, μg/m3 (allowed is 50) | PM10 annual average to here where reported, μg/m3 (allowed average is 25) |
|---|---|---|---|---|---|---|
| January, 2019 | 10.6 | 24.9 | ||||
| February, 2019 | 6.4 | 19.8 | ||||
| March, 2019 | 7.4 | 19.7 | ||||
| April, 2019 | 9.5 | 37 | 19.6 | |||
| May, 2019 | 11.1 | 41 | 21.8 | 75.3 | ||
| June, 2019 | 8.9 | 14.6 | ||||
| July, 2019 | 7.9 | 16.7 | ||||
| August, 2019 | 7.5 | 18.3 | ||||
| September, 2019 | 6.3 | 18.4 | ||||
| October, 2019 | 10.2 | 62 | 25.5 | |||
| November, 2019 | 18.7 | 66.8 | 38.9 | 120.9 | ||
| December, 2019 | 22.2 | 73.4 | 43.0 | 131.8 | ||
| January, 2020 | 23.8 | 116.1 | 11.7 | 39.3 | 109.6 | |
| February, 2020 | 5.1 | 11.6 | 18.0 | |||
| March, 2020 | 5.8 | 11.4 | 15.5 | |||
| April, 2020 | 8.5 | 17.3 | ||||
| May, 2020 | 7.1 | 13.3 | ||||
| June, 2020 | 8.8 | 13.4 | ||||
| July, 2020 | 9.7 | 13.6 | ||||
| August, 2020 | 8.9 | 29.0 | 12.8 | |||
| September, 2020 | 7.0 | 15.7 | ||||
| October, 2020 | 7.6 | 25.2 | 14.9 | |||
| November, 2020 | 9.8 | 19.5 | ||||
| December, 2020 | 6.7 | 16.8 | ||||
| January, 2021 | 8.0 | 16.8 | ||||
| February, 2021 | 7.9 | 14.4 | ||||
| March, 2021 | 6.0 | 16.1 | ||||
| April, 2021 | 9.5 | 33.8 | 20.0 | |||
| May, 2021 | 8.3 | 43.8 | 13.8 | |||
| June, 2021 | 7.4 | 12.2 | ||||
| July, 2021 | 7.5 | 11.9 | ||||
| August, 2021 | 8.0 | 34.8 | 12.6 | |||
| September, 2021 | 5.4 | 12.3 | ||||
| October, 2021 | 6.3 | 14.4 |
| Daily Target Exceedances | ||
|---|---|---|
| Reason in reports | Pollutant | Days |
| Hazard reduction burning | PM2.5 | 30/8/2020, 3/10/2020, 27/4/2020, 30/4/2020, 22/8/2021 |
| Reason not given nor required to be given | PM2.5 | 29/4/2019, 21/5/2019, 22/5/2019, 30/10/2019, 31/10/2019, 1/11/2019, 2/11/2019, 11/11/2019, 12/11/2019, 19/11/2019, 21/11/2019, 26/11/2019, 29/11/2019, 2/12/2019, 3/12/2019, 4/12/2019, 5/12/2019, 6/12/2019, 7/12/2019, 10/12/2019, 19/12/2019, 21/12/2019, 31/12/2019, 4/1/2020, 5/1/2020, 8/1/2020, 12/1/2020, 23/1/2020, 24/1/2020, 25/1/2020 |
| PM10 | 27/5/2019, 30/10/2019, 31/10/2019, 12/11/2019, 19/11/2019, 21/11/2019, 26/11/2019, 29/11/2019, 2/12/2019, 3/12/2019, 4/12/2019, 5/12/2019, 6/12/2019, 10/12/2019, 19/12/2019, 21/12/2019, 31/12/2019, 2/1/2020, 4/1/2020, 5/1/2020, 8/1/2020, 11/1/2020, 12/1/2020, 17/1/2020, 24/1/2020 | |
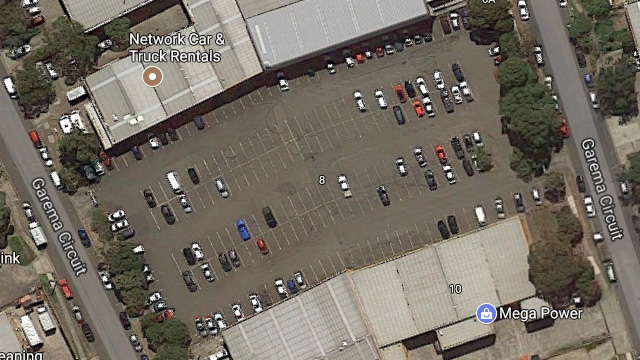
A Kingsgrove resident put forward the council car park at Garema circuit on October 17. That idea was well received. It is in my opinion better than the locations proposed by the project team, with the possible exception of Canterbury Golf Course. The car park is owned by Canterbury-Bankstown Council.
This location was not among the top three locations for Kingsgrove in the materials for March 5. The decision to drop this location was more hotly contested, and by more people, than any other at the March 5 meeting. It turns out that the project team had not sought the opinions from air quality experts about this site and had not approached Council about this site.
The reason that the project team gave was that the site was too vandalism-prone. The team warned of the risk of a month of data to be lost if the station is vandalised. It was also mentioned (not by the project team) that the car park is a popular spot for car hoons to do burn-outs (which could affect readings). At the meeting I proposed cameras to deter vandals and bollards to deter hoons. There may be more possible measure like better lighting, better fortification of the monitoring stations and speed humps.
The outcome of the March 5 meeting was that the project team had to go back and reconsider the site. Initially, the team seemed to think it was just a matter of answering some more questions. But actually, what the community and Council representatives wanted and what was agreed was that the team needs to properly evaluate and consider it.
On September 10, we met again. Canterbury-Bankstown Council did not have a representative at the meeting. According to the project team, the team had approached Council but Council said that there was a covenant on the site which meant that the car parking in the park could not be sacrificed for a monitoring station without consent of a whole lot of businesses nearby. Basically, according to the team, Council considered the site not feasible. As there was no representative from Council present, this was impossible to refute.
Also, according to the team, the compulsory acquisition process takes up to 18 months which is too long.
The project team put forward Canterbury Golf Course as a possible location. The land is owned by Canterbury-Bankstown Council. No exact location was proposed. At the Rosebank Avenue end, the modelling shows relatively high impact. But other parts of the golf course are too far away. I have taken a photo of a spot right next to the golf course at the bottom of Rosebank Avenue which seems suitable. I proposed that spot to the AQCCC organisers on Sunday, October 29. The project team expressed a willingness to investigate this possibility even though I submitted it a little late. In the March 5 meeting it was not mentioned at all. I let it slide because I figured it was better to concentrate on the Garema Circuit car park which had had so much support on October 17.
However, we received some written communication in August according to which the project team did approach Council about the site. This would have been after the March 5 meeting as the project team had conceded on March 5 that they had not approached any Council about any site. In summary, according to the project team, Council said its internal processes for handing over Council land take too long and Council recommended invoking the compulsory acquisition process. According to the project team, the compulsory acquisition process can also take 18 months. Again, the absence of a representative from Council at the September 10 meeting meant that what the project team said was impossible to refute.
| Month | PM2.5 monthly average, μg/m3 (yearly allowed average is 8) | PM2.5 highest 24 hours period, μg/m3 (allowed is 25) | PM10 monthly average, μg/m3 (yearly allowed average is 25) | PM10 highest 24 hours period, μg/m3 (allowed is 50) | Highest CO rolling 8 hour average, ppm (allowed is 9) | Highest NO2 hourly average, ppb (allowed is 120) |
|---|---|---|---|---|---|---|
| July, 2015 | 9.6 | 19.9 | 18.8 | 31.1 | 2.1 | 45.0 |
| August, 2015 | 9.5 | 33.6 | 15.3 | 23.5 | 1.4 | 43.0 |
| September, 2015 | 7.0 | 10.8 | 16.6 | 28.4 | 1.1 | 44.0 |
| October, 2015 | 10.6 | 41.8 | 25.0 | 88.0 | 1.6 | 62.0 |
| November, 2015 | 9.2 | 15.8 | 17.8 | 33.2 | 0.8 | 59.1 |
| December, 2015 | 9.1 | 16.7 | 15.1 | 23.4 | 0.7 | 48.0 |
| January, 2016 | 6.3 | 13.6 | 14.3 | 25.5 | 0.6 | 40.7 |
| February, 2016 | 5.7 | 9.8 | 15.8 | 24.8 | 0.8 | 39.8 |
| March, 2016 | 5.2 | 11.8 | 13.4 | 23.2 | 0.8 | 43.8 |
| April, 2016 | 9.1 | 17.8 | 18.1 | 31.4 | 1.1 | 63.5 |
| Daily Target Exceedances | ||
|---|---|---|
| Reason in reports | Pollutant | Days |
| Unspecified Local Event | PM2.5 | 13/10/2015 |
| Unspecified Local Event | PM10 | 13/10/2015 |
| Hazard reduction burning | PM2.5 | 21/8/2015 |
| Month | PM2.5 monthly average, μg/m3 (yearly allowed average is 8) | PM2.5 highest 24 hours period, μg/m3 (allowed is 25) | PM10 monthly average, μg/m3 (yearly allowed average is 25) | PM10 highest 24 hours period, μg/m3 (allowed is 50) | Highest CO rolling 8 hour average, ppm (allowed is 9) | Highest NO2 hourly average, ppb (allowed is 120) |
|---|---|---|---|---|---|---|
| July, 2015 | 8.3 | 18.5 | missing | missing | 1.7 | 36.0 |
| August, 2015 | 8.5 | 35.1 | missing | missing | 1.1 | 40.0 |
| September, 2015 | 5.5 | 10.1 | 16.6 | 29.9 | 0.7 | 35.5 |
| October, 2015 | 7.0 | 16.3 | 27.7 | 57.2 | 0.9 | 49.1 |
| November, 2015 | 6.6 | 11.3 | 14.4 | 18.1 | 0.4 | 48.5 |
| December, 2015 | 6.3 | 12.8 | 23.6 | 33.1 | 0.5 | 49.9 |
| January, 2016 | 7.2 | 15.6 | 21.8 | 34.3 | 0.6 | 38.8 |
| February, 2016 | 6.0 | 10.3 | 19.0 | 28.2 | 0.6 | 25.2 |
| March, 2016 | 5.3 | 11.4 | 14.6 | 22.9 | 0.6 | 33.1 |
| April, 2016 | 9.5 | 21.2 | 18.2 | 32.1 | 1.0 | 47.4 |
| May, 2016 | 10.8 | 35.5 | 21.4 | 48.7 | 1.1 | 43.9 |
| June, 2016 | 7.7 | 16.2 | 14.2 | 26.7 | 1.7 | 33.3 |
| Daily Target Exceedances | ||
|---|---|---|
| Reason in reports | Pollutant | Days |
| Unspecified regional event | PM10 | 7/10/2015 |
| Hazard reduction burning | PM2.5 | 21/8/2015, 23/5/2016, 24/5/2016 |